‘It is difficult to make predictions, especially about the future’, is a maxim (attributed to Yogi Berra, an American baseball player and coach) that I subscribe to. Another is Warren Buffet’s ‘forecasts may tell you a great deal about the forecaster; they tell you nothing about the future.’
Despite the inherent difficulty in making predictions, they are necessary from time to time, for example in predicting future cattle prices for use in beef business budgets.
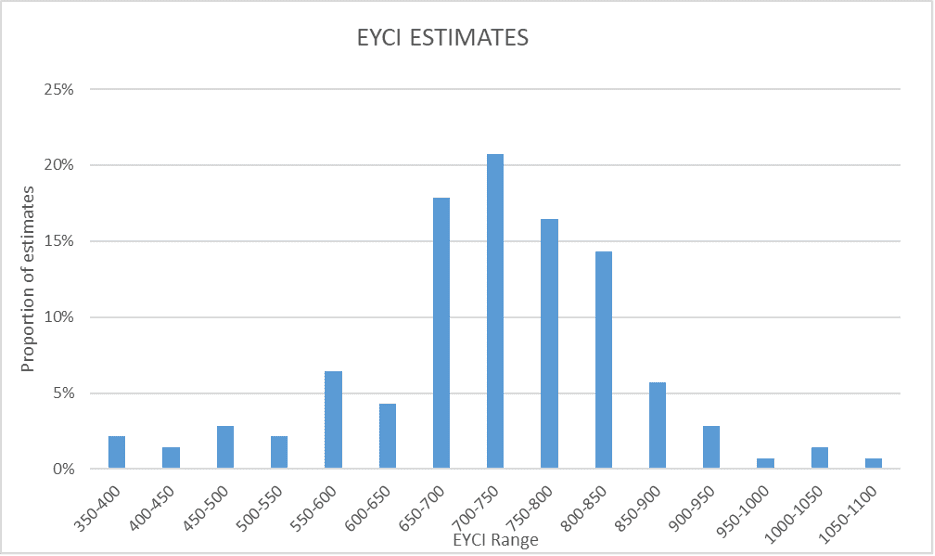
The Beef Central EYCI guess competition caught my eye and I thought it may be interesting to see what the range of guesses were and where readers thought the market would end the year. To help with this process, I was able to convince my daughter (thank-you Georgia!) to go through the guesses and put them all in a spreadsheet to analyse.
The guesses for the competition formed a rough bell curve around an average of 724, as shown in graph.
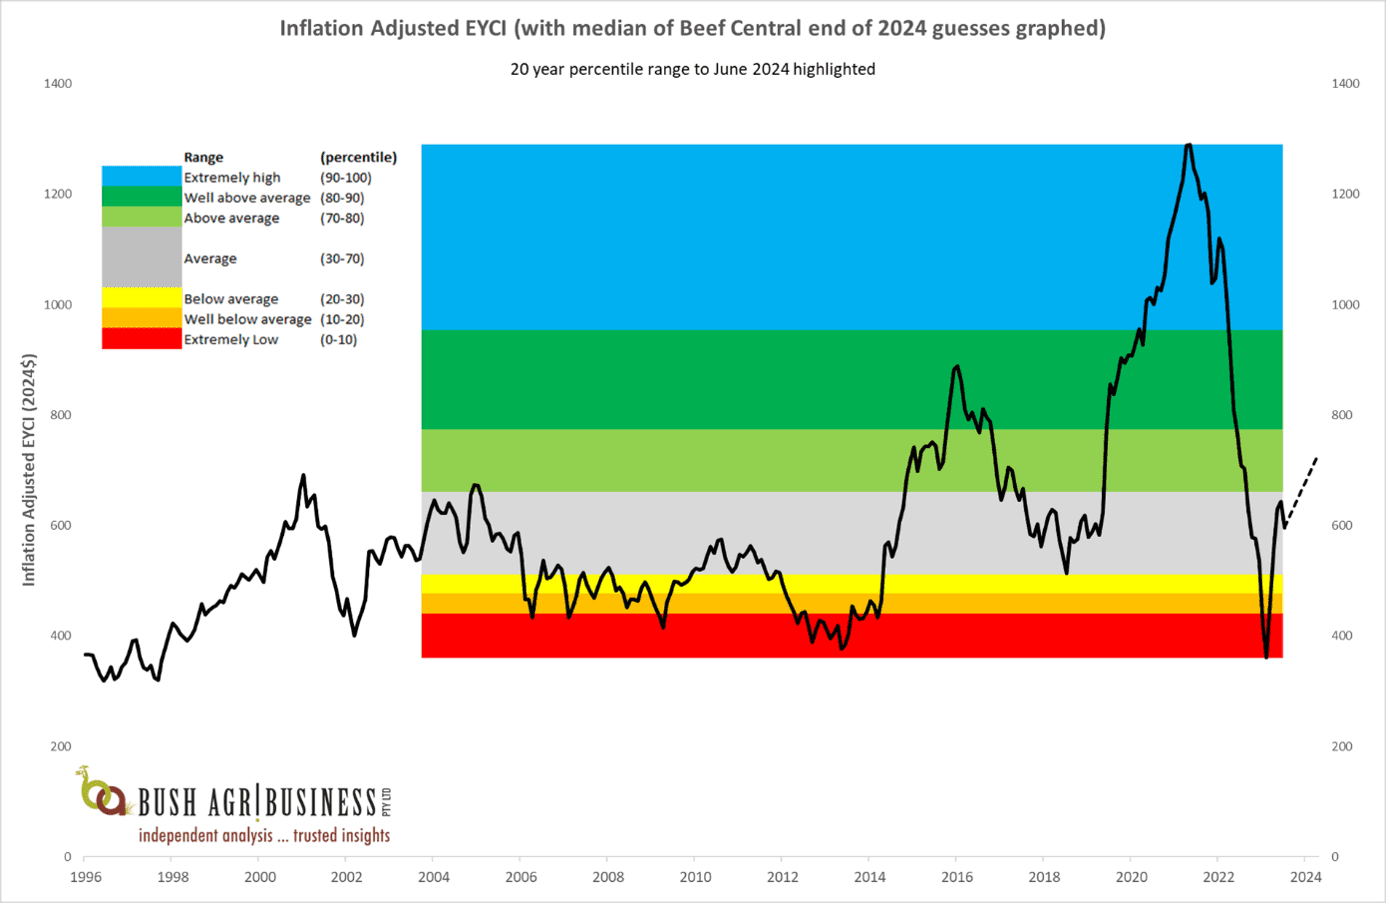
The below graph shows the long-term EYCI data, expressed in real terms (i.e. with the effect of inflation removed) and with the percentile ranges of the last 20yrs displayed using the horizontal colour bands. The EYCI is graphed up to March when the competition ended, a dotted line then graphs out to the year closing average of guess of 724.32.
If the EYCI does close at 724 in December, then that would put it in the 76th percentile of real prices for the last 20yrs (i.e. in inflation adjusted terms, the EYCI has been lower than 724 for 76pc of months over the last 20 years). Kate Rogers’ guess was closest to the average at 724.31, Ardie Lord was the most optimistic with a guess of 1,080 (94th percentile) and William Bright the least optimistic with 355.5 (less than lowest real price over the last 20yrs).
For context, the EYCI closed June at 581.07, which puts in the 48th percentile of 20yr real prices.
And for the record, if the competition closed now, half way through the year, the “closest to the pin” winner would be reader Regan Nguon, who guessed 579.50.
What does this mean in terms of industry profits?
Beef prices obviously have a big impact on the profitability of beef businesses; however, they can be a distraction. Our analysis has consistently found that while beef prices have a big impact on the profit of beef businesses year to year, they explain very little of the difference in long term profits between businesses.
This is a critical point to understand, for those interested in profitable beef businesses. We see in our data the impact of changes in beef prices year to year on the bottom line of beef businesses. When prices are higher, income increases, often followed by costs, and profit generally increases. The reverse happens when prices fall. However, when we compare the long-term performance of businesses and analyse what separates the best from the rest, there is minimal, if any, difference in price received between the best and the rest.
The better businesses generally have more productive herds, better targeted expenditure, better labour efficiency and a lower cost of production.
We’ve looked back through the 18 years of industry performance data we have from the Australian Beef Report to look at how income, and costs, change with changes in the EYCI. As you’d expect, annual income (per animal unit) is highly correlated (0.9+) with changes in the EYCI. Costs are also highly correlated (~0.7) with changes in the EYCI, demonstrating when income rises expenditure soon follows.
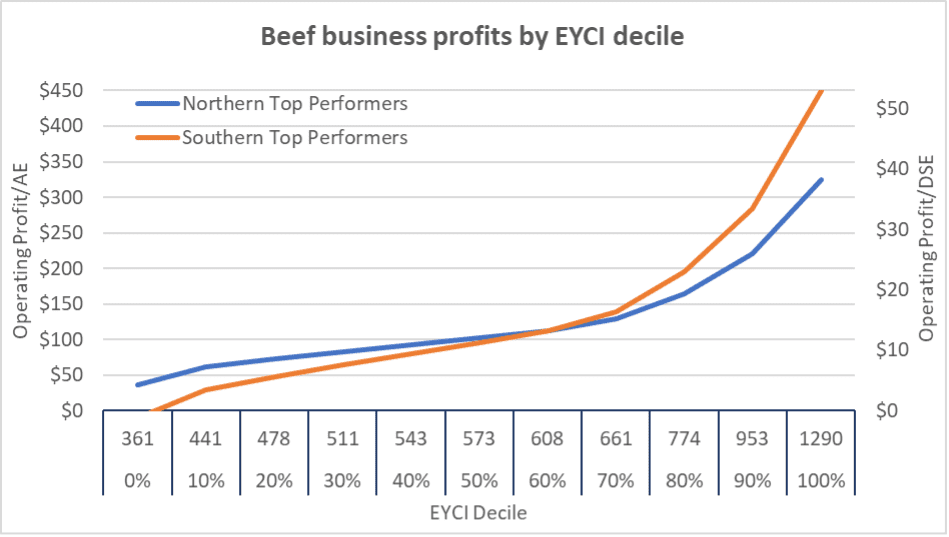
Using this data we’ve modelled (keeping in mind that all models are wrong, some are useful!) industry profits (in 2024 dollars) across the full range of the EYCI over the last 20years. We’ve used Top 25pc performance to do this as this reflects the business’s we work; our client performance is equivalent to the Top 25pc of the wider industry. It is also because you cannot afford to be average in agriculture; it is where the cream of the crap meets the worst of the best.
The results of this exercise are graphed below, showing what the modelled operating profits (earnings before interest and tax) for the Top 25pc performers in northern and southern Australia across the full range of the EYCI over the last 20yrs. The results for north and south are quite similar, albeit with the south having a higher range. The results for average industry performers are much starker.
This is an exercise in curiosity and mainly for interest. Although I would be fascinated the know how it corresponds with the budgeted profits buyers must be using in order to justify some of the property purchases that are occurring at the moment!
The reality is that price is not a variable that producers can have a lot of influence over, relative to general moves in the market. Attention is better placed on reducing your cost of production through improving herd productivity and ensuring you have a competitive cost base (i.e. focusing on the things you can influence). Those business with a low cost of production have a reasonable margin locked in through the full price cycle, as shown above (with the exception of the top southern producers at the very bottom of the market).
Those top performers have the luxury of being able to sit back in December and see where the EYCI closes, and whose guess was the closest, and be comfortable that their business will be making a profit regardless.
HAVE YOUR SAY